Key Insights:
- Polkadot (DOT) forms a falling wedge pattern, signaling a bullish reversal.
- A breakout above $5.30 could lead to a rally toward $6.52 and higher targets.
- Positive market sentiment, including the Polkadot ETF filing, suggests further growth.
Polkadot (DOT) indicates strong signs of recovery after testing the support level at $4 on the daily charts. Over the past seven days, DOT price has recovered more than 8% and was set for a massive rally.
This level has indeed proved its significance as it sparked the previous rally between mid-November and mid-December.
At press time, Polkadot price was trading at $4.30, noting an intraday drop of over 2.20%. Its market cap soared to $6.84 Billion, ranked 21th in the overall crypto market.
Bullish Turnround Ahead for Polkadot
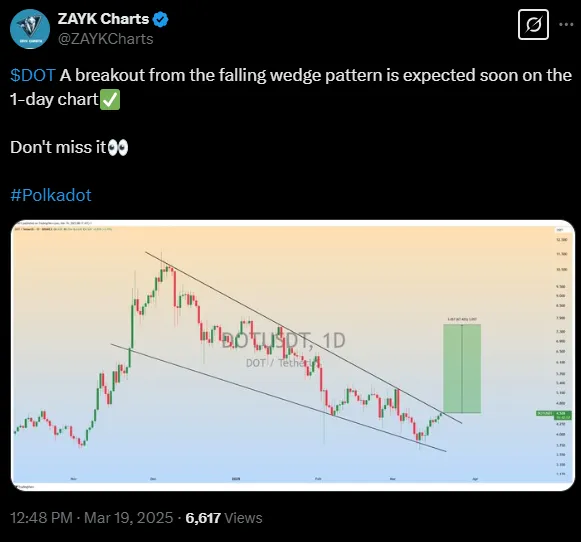
A recent analysis by ZAYK Charts on X suggests that DOT price may be gearing up for a significant rally. According to the analyst, DOT’s daily chart presents a falling wedge pattern, indicating this might be an opportune moment to buy the asset.

Furthermore, if it breaches the trendline hurdle of $5.30, it could rally toward the $7 mark in the next few weeks.
Adding to the bullish outlook, the submission of the 21Shares Polkadot ETF application to NASDAQ followed Grayscale’s application by 21 days creating favorable market sentiments for Polkadot.
The firm requested ETF listing approval through a registration process under Form 19b-4 to the SEC.
The company remains focused on developing multiple crypto ETFs with XRP standing among them.
The rising institutional focus on Polkadot indicates price appreciation potential by driving up market demand.
Polkadot Price Prediction: Will Bulls Take Charge?
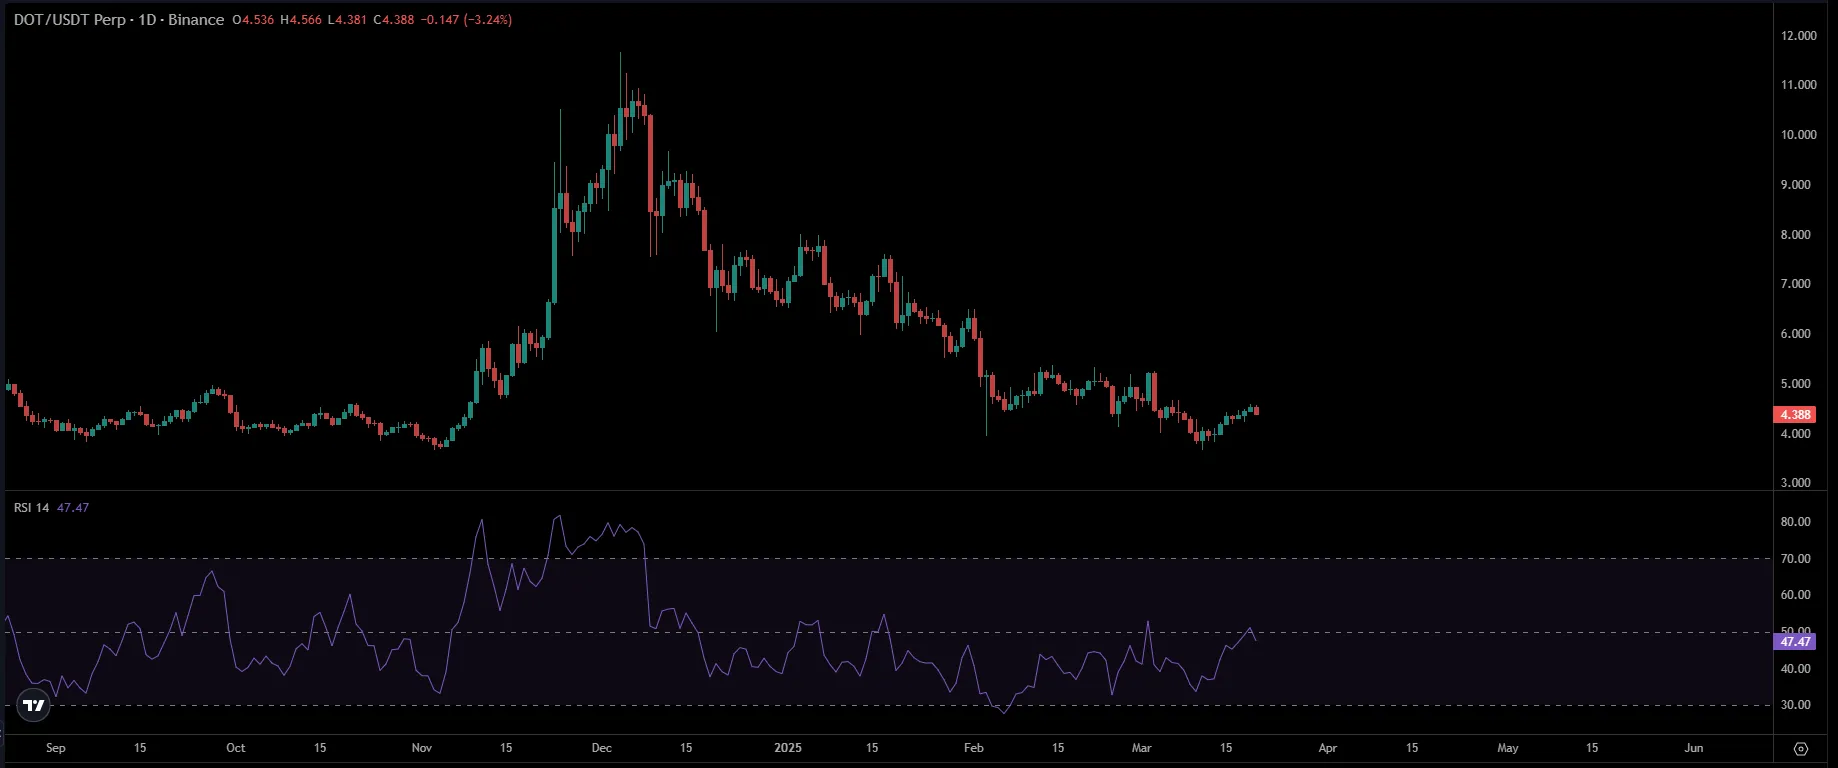
On the daily timeframe, DOT price was edging closer to the trendline hurdle of the falling wedge pattern. Following a recovery over 8%, the mighty bulls were aiming to register a breakout above the $5 mark.
However, DOT must sustain its bullish momentum to overtake the 50 day EMA barrier. If the bulls hold past the zone, Polkadot price could target the $6-$7 zone in the next few sessions.
Meanwhile, failure to sustain above the 50 day EMA mark, a retest of $4 support and below is possible.

Polkadot’s 24-hour RSI line stood at 47 signaling a positive crossover on the chart. It shows that DOT has a significant room for upside move ahead.
Moreover, the short-term moving averages (10-20 EMA/SMA) suggested bullish momentum, a sign of reversal.
Furthermore, the liquidation data from Coinglass shows that $355k worth of short positions have liquidated against $133k in longs.
This imbalance suggests that the bear cartel looks uncomfortable and started covering their positions, which could trigger further upward movement ahead.
Moreover, the Open Interest (OI) shed over 1.12% to $304.84M, revealing short covering activity in the past 24 hours.

Despite the bullish on-chain readings, DOT bulls must keep the recovery continuing ahead to confirm the reversal targeting the $5 breakout.
The immediate support zones were $4.20 and $3.80, whereas the resistance zones were $5.30 and $6.
Disclaimer
In this article, the views and opinions stated by the author or any people named are for informational purposes only, and they don’t establish the investment, financial, or any other advice. Trading or investing in cryptocurrency assets comes with a risk of financial loss.

Ekaterina Sokolova is known for her dynamic coverage of cryptocurrency markets and blockchain advancements. Her articles, featured in several prominent digital outlets, combine thorough research with a clear presentation style that demystifies complex technological trends for her readers.


