Key Insights
- Chainlink price formed a double bottom pattern, signaling a potential breakout to $21.
- Whale activity remains strong, with 67% of LINK held by large investors.
Following a significant decline of 32% last month, Chainlink (LINK) price has started to recover, posting a surge of 7.78% this week.
Analysts believe Chainlink price has the potential for a breakout because it forms a double bottom pattern on the daily chart. The pattern signals a bullish outlook as LINK seemed to be ready for a potential upmove.
Market analyst Ali Martinez suggests that LINK price might see a surge towards $21 following the double bottom pattern formation.
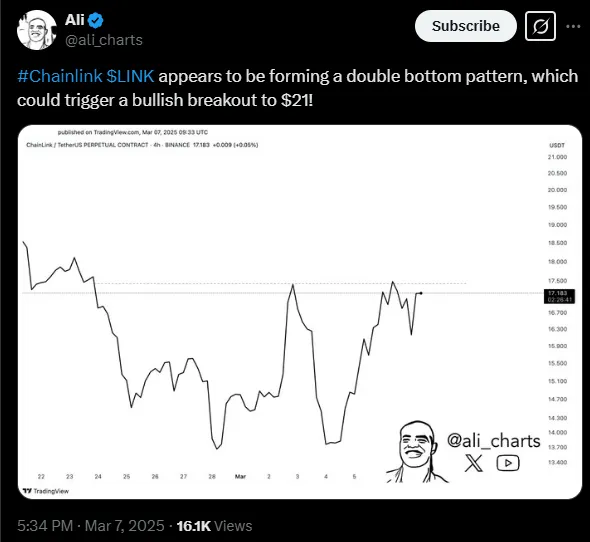
At press time, Chainlink’s price was trading at $15.73, with an intraday decline of over 4.20%. Its market cap stood at $10.03 Billion and the trading volume dropped over 16.39% intraday.
Institutional Buyers and Whales Fuel Market Accumulation
Data from IntoTheBlock shows large investors remain interested in Chainlink crypto because they control more than 67% of the supply.

Recent institutional engagement has increased significantly because transactions above $100k reached $751.03 during the past week.
Exchange netflow data reveal -$4M in negative flows. It demonstrates tokens are being removed from exchanges for long term storage by users. LINK’s exchange netflows amounting to -$4M reduce selling pressure, which strengthens the bullish outlook.
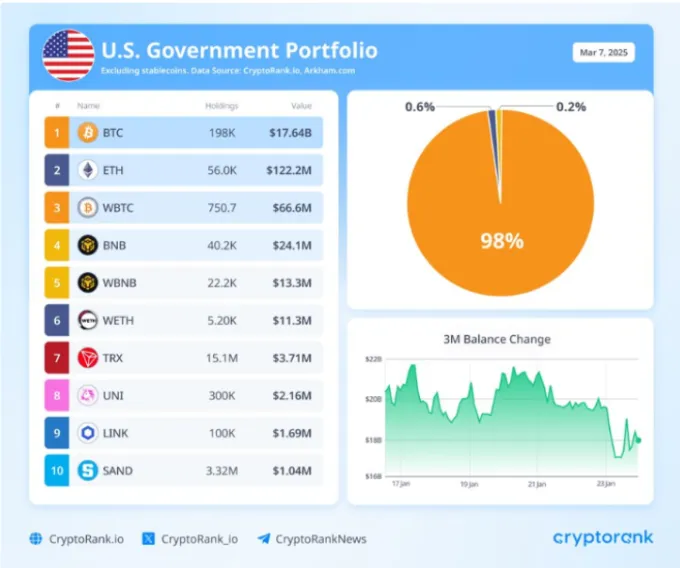
According to CryptoRank.io, the U.S government seems to possess LINK coins. This information raises doubts about whether these coins could be integrated into government crypto strategic reserves.
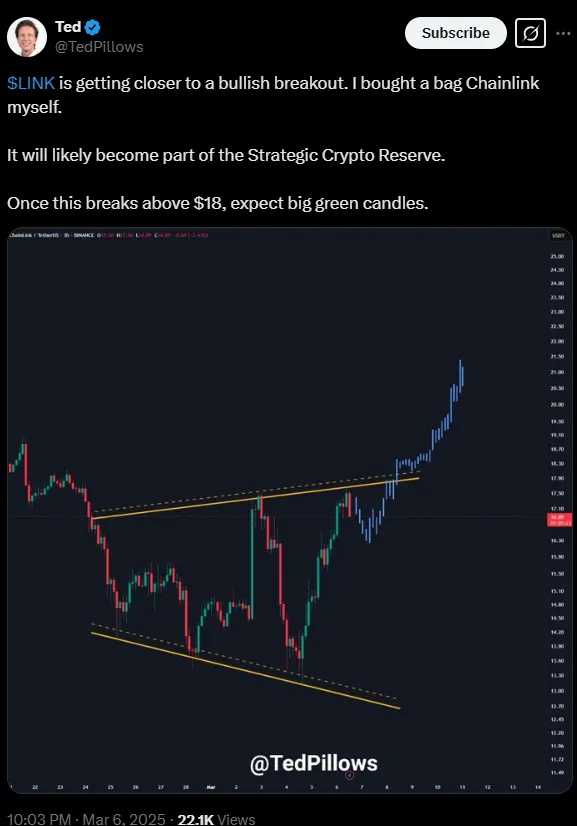
According to TedPillows and other analysts, LINK crypto has the potential to enter the strategic crypto reserves. That might strengthen its price outlook in the long term.
Chainlink Price Prediction: Is Momentum Shifting?
LINK has rebounded from its key $13-$14 accumulation zone, indicating strong buying interest. It re-entered the channel’s trajectory and could see a potential bullish breakout next.
Once it clears the $18 hurdle, it could see a potential rally toward the $21 mark in the coming sessions.
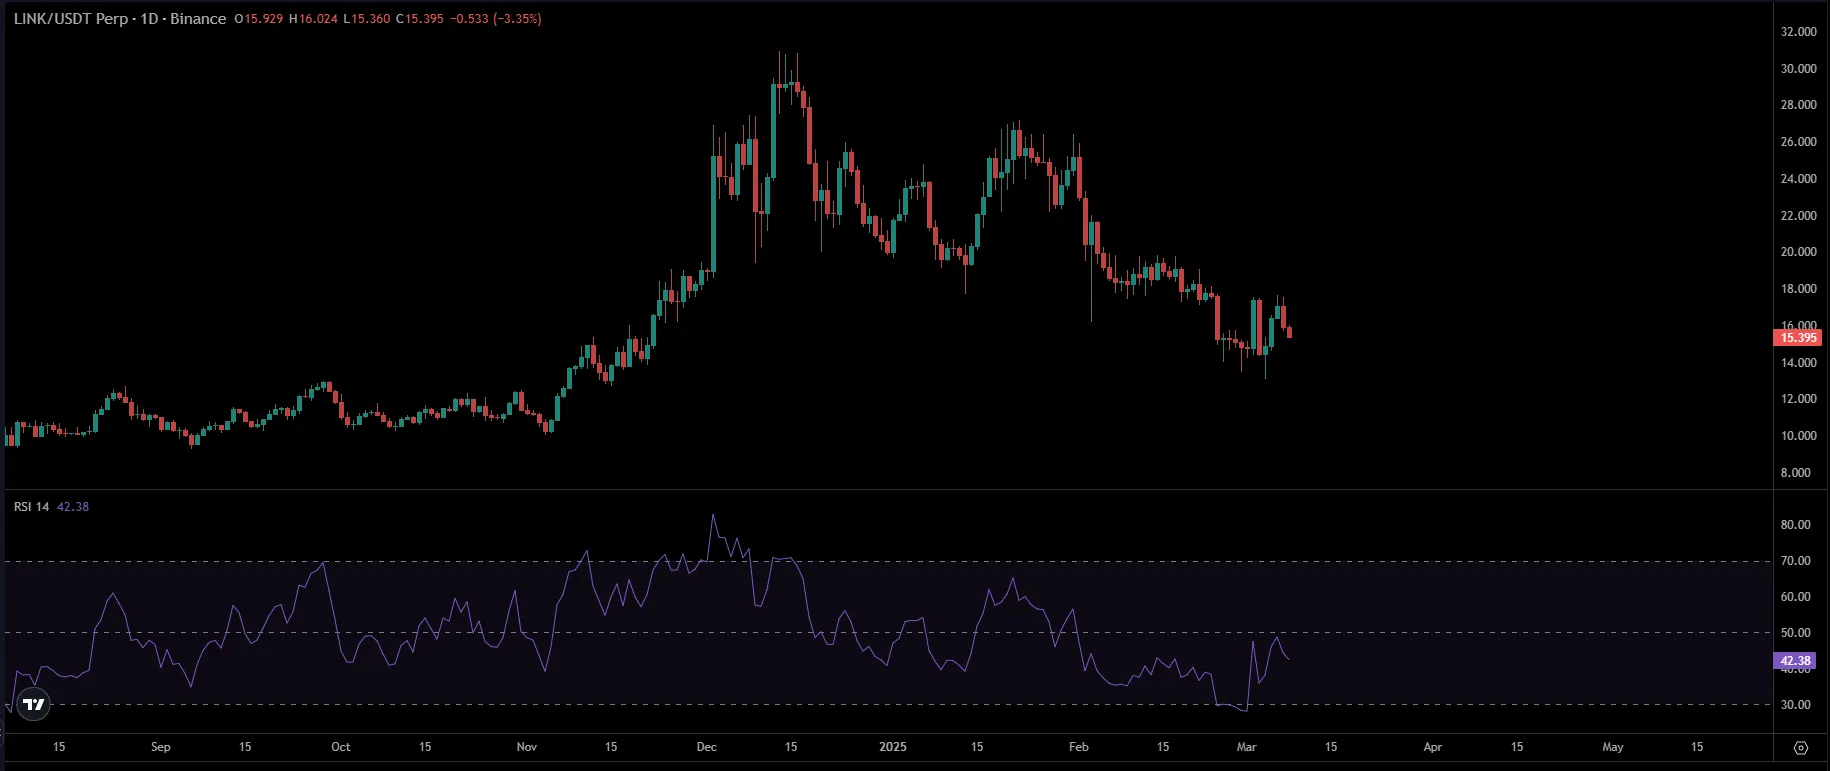
At the time of writing, the Relative Strength Index (RSI) line stood at 42. That suggested Chainlink price was approaching the neutral zone and had room for upside momentum.
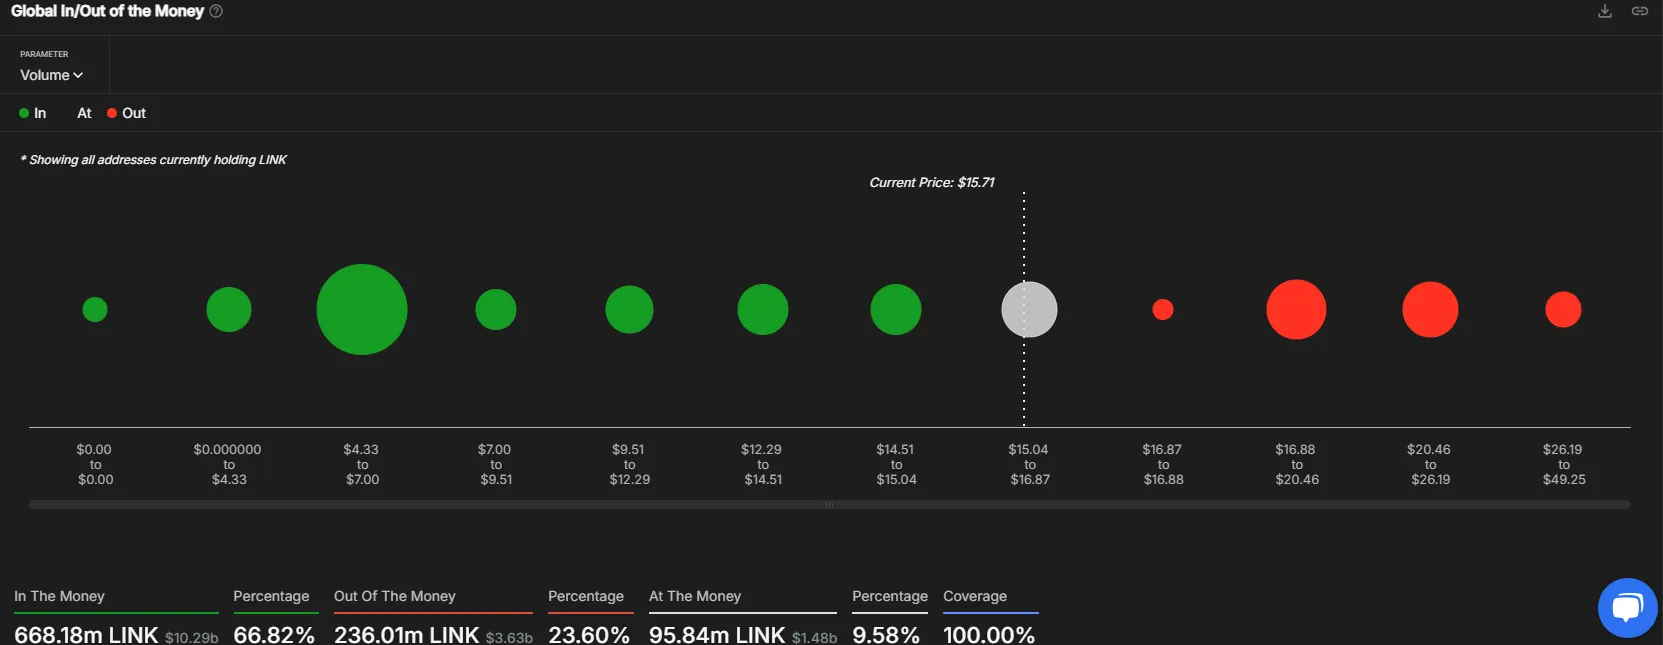
On-chain data revealed that 66% of LINK holders are in the money, whereas 24% of the holders are out of money, meaning they are holding at a loss. This imbalance suggests that LINK price starts climbing, and many holders may look to sell at breakeven or minimal profit, creating potential resistance zones.
Data from CoinGlass shows that $323.06k worth of long positions were liquidated, compared to $27.39k in shorts. It indicates that bullish traders remain active. If LINK breaks key resistance, more short liquidations could fuel a stronger price rally.
The Open Interest (OI) shed over 11.65% to $455.80 Million, witnessing a long unwinding move in the past 24 hours.
Additionally, if LINK price breaks above the $15 hurdle, it could trigger a bullish shift. On the other hand, if selling pressure intensifies, bears could regain control. That could lead to the follow-on selloff and a decline below the $15 mark.
Disclaimer
This article is for informational purposes only and provides no financial, investment, or other advice. The author or any people mentioned in this article are not responsible for any financial loss that may occur from investing in or trading. Please do your research before making any financial decisions.

Mahsa Rezaei is a forward-thinking crypto journalist based in Tehran with a strong background in computer science and finance. Specializing in blockchain technology and its impact on Iran’s economic reforms, her investigative articles and in-depth analyses are widely read by tech enthusiasts and policy makers alike.
