


- Bitcoin’s rally to a new all-time high has just confirmed its historical post-halving cycle pattern.
- Analysts say the fourth quarter is the most likely window for the cycle top.
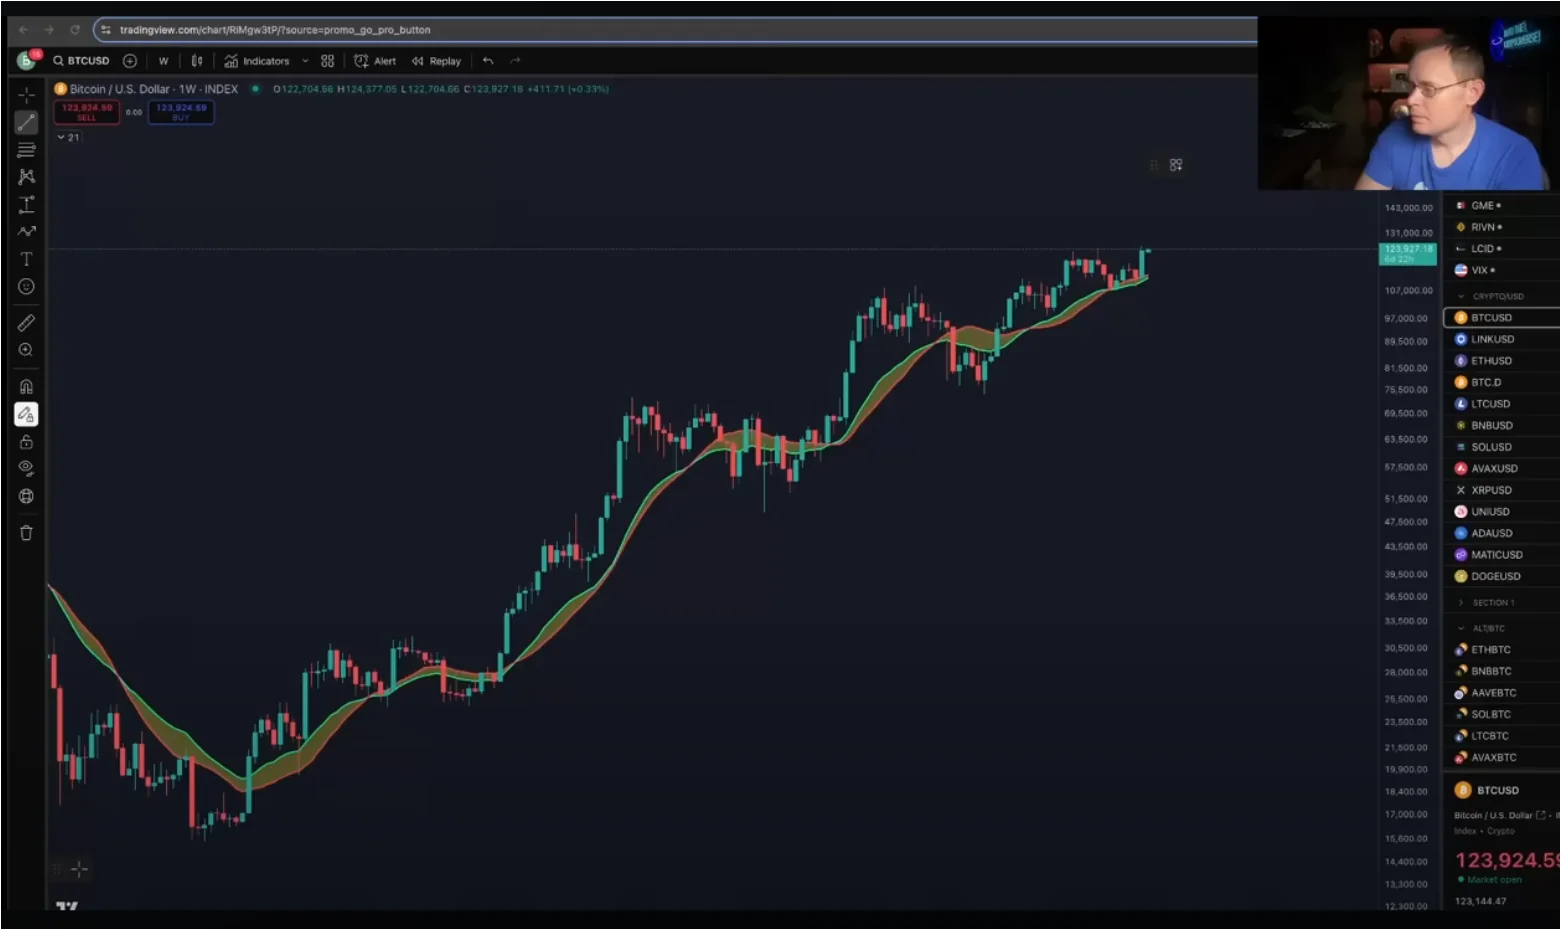
- Holding the 50-week moving average is important for Bitcoin to hold the uptrend.
The strongest Bitcoin supporters have proven themselves once again.
The world’s leading cryptocurrency recently set a new all-time high above $125,000 after rebounding from a major technical foundation. This surge, which was observed in early October, stands in line with patterns that have historically affected Bitcoin’s post-halving bull markets.
Market analyst Benjamin Cowen of Into The Cryptoverse says that this is not a random rally. He argues that the move shows Bitcoin’s cycle structure, and investors should watch technical levels that determine how long the current run can last.
Bitcoin Support and the Historical Cycle
Certain Bitcoin support levels have been an important part of many rallies in the past, since the asset’s inception. Cowen’s recent YouTube update shows that the asset has followed a consistent pattern in post-halving years, which tends to guide market expectations.
Cowen identified a three-step pattern that has defined Bitcoin’s previous bull runs:
The first is that a local high tends to form in August or early September. A pullback follows soon after and creates a low in September.
A strong Q4 rally then drives Bitcoin to a cycle peak, which often happens in October, November, or December.
This cycle played out in 2013, 2017, and 2021. The new all-time high set in early October seems to validate the same pattern. According to Cowen, every major cycle top so far has happened in the fourth quarter of the post-halving year.
Bull Market Support and the 50-Week Moving Average
For Cowen, the discussion is not just about time. Technical signals are the real markers of when the cycle ends. Among these, he pointed out two major ones: the bull market support band and the 50-week moving average (50W MA).
The recent breakout above $125,000 started when Bitcoin bounced off the bull market support band. Cowen notes that this move is similar to the structure seen in 2020. Then, as now, Bitcoin staged a brief pullback after a rally, found support at the band, and rose to a new high.
This repeating structure shows that the market continues to follow historical patterns.
Additionally, Cowen pointed out that Bitcoin’s bull cycle usually ends after the price fails to hold above the 50W MA. The confirmation signal is two consecutive weekly closes below this level.
At present, the 50W MA currently sits near $101,000. This means that staying above it keeps the uptrend intact. A break below would indicate that the macro bull cycle has peaked.
Divergence Between Time and Sentiment
While Bitcoin support levels show strength, Cowen sees a discrepancy between time-based cycle metrics and investor sentiment.
For example, according to Cowen, when measured from the absolute low, the current cycle has already broken above the length of the previous one.
This timing indicates that the market may be late in its rally. Yet, if measured from peak to peak, the data shows that there could still be weeks left before the final top.
Cowen pointed out the absence of typical late-cycle euphoria.
Despite the new all-time high, retail investor enthusiasm is still muted, compared to previous peaks. Social risk indicators also show relatively low excitement.
For Cowen, this either means the parabolic phase is still ahead or that the cycle is behaving differently this time. This said, he still expects one final euphoric rally before the market tops out.
Bitcoin Dominance and Liquidity Flow
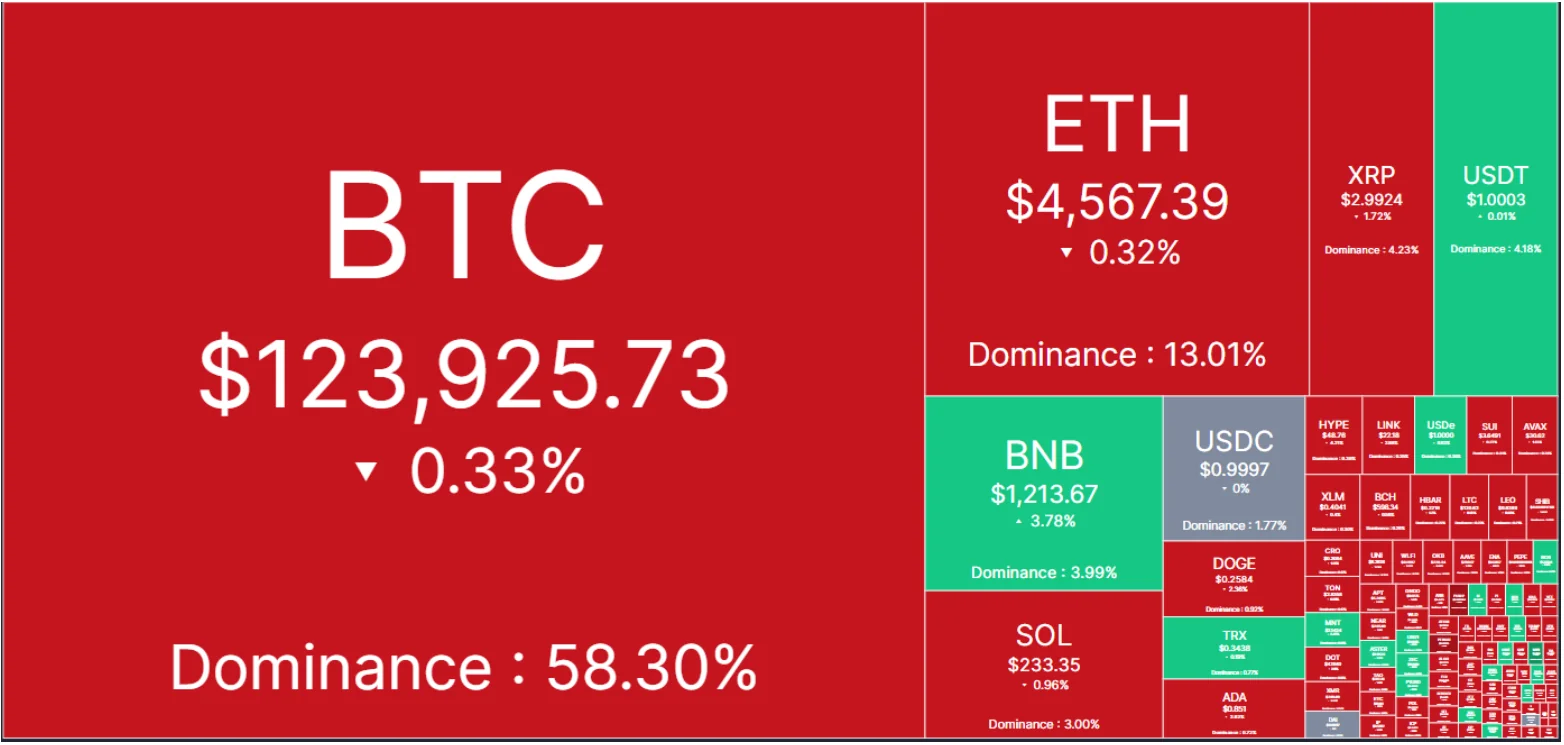
Another sign supporting Bitcoin’s strength is its rising market dominance.
Cowen noted that rising Bitcoin dominance usually comes before strong price moves and new highs. Capital is flowing into Bitcoin from altcoins. This means that traders prefer the leading cryptocurrency over riskier alternatives during this phase of the cycle.
This trend could continue to limit gains in the altcoin market while Bitcoin consolidates its lead.
Market Snapshot: Recent Price Action
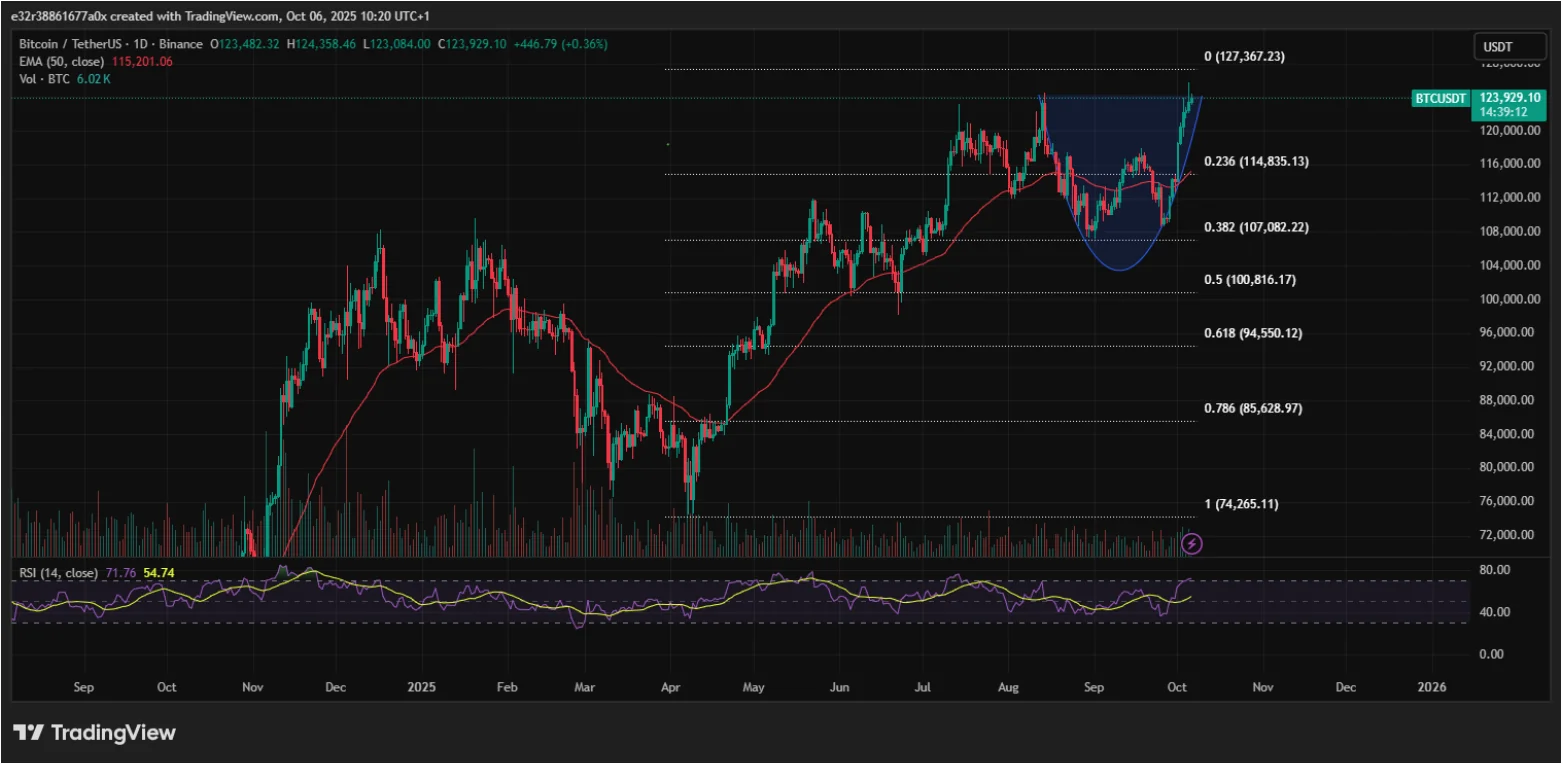
Bitcoin’s recent rally shows the importance of technical support levels. After turning $120,000 into a solid base, the asset climbed above $125,000 before pulling back.
At the time of writing, Bitcoin was trading near $123,000 and was consolidating. Analysts expect that a close above $125,500 could set the stage for another breakout toward $128,000 or even $130,000.
The first major support sits at $123,000, with further levels at $122,250 and $121,500. A drop below $118,500 would raise questions about how durable the uptrend is.

Ivan Petrov is a seasoned journalist with deep insights into Russia’s dynamic crypto landscape. His work focuses on market dynamics and the transformative potential of blockchain technology, making him a go-to expert for understanding Russia’s digital financial innovations.