


Key Insights:
- Bitcoin price reclaimed $115,000 after a modest rebound during the week
- Derivatives markets are guiding the trend as spot demand weakens further into the year.
- Strong resistance lies above $116,000, while several supports sit below.
Bitcoin price managed to push back above $115,000 after a 1.5% daily gain, and this level has become a short-term pivot. Traders are now watching whether this recovery can hold, especially with major resistance overhead and layered supports beneath it.
Derivatives Markets Now Driving Bitcoin Price
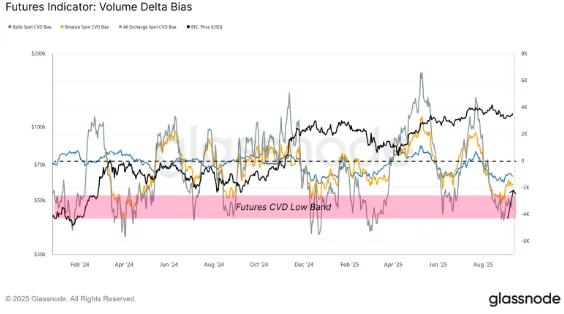
Spot demand has slowed, and ETF inflows are currently soft. Market intelligence firm Glassnode noted in a recent report that attention has shifted toward derivatives, which are influencing near-term direction.
The cryptocurrency’s recent rebound from $108,000 showed an important trend.
Particularly, Bitcoin’s volume delta bias, which measures the difference between buying and selling pressure, turned upward. This indicates that sellers across exchanges like Binance and Bybit may be exhausted.
Open interest in Bitcoin options has also reached an all-time high of $54.6 billion, up 26% from early September. This said, the majority of positions lean toward calls rather than puts.
In essence, traders expect higher prices while still guarding against downside risks.
It is worth mentioning that the last time options activity peaked in mid-August, Bitcoin surged to over $124,500. Analysts are now seeing derivatives positioning as more balanced than before, which could support a steadier climb.
Resistance and Support Levels for Bitcoin Price
Bitcoin is now facing a supply wall between $116,000 and $121,000. Breaking above this range would open the door to a push toward its previous all-time highs.
However, bears are likely to defend the $116,000 level strongly. If rejected, price could slip back toward the $114,500 to $112,200 zone. This area contains both the 50-day and 100-day simple moving averages, which makes it an important support cluster.
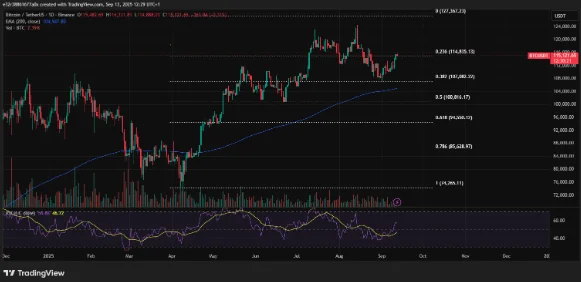
Another important zone lies between $107,200 and $110,000 and marks the September low as an important psychological level.
Data from CoinGlass now shows liquidity clusters between $116,400 and $117,000. If Bitcoin clears this area, a liquidation squeeze could occur and force short sellers to cover positions, while driving the price closer to $120,000.
On the downside, heavy bid orders sit near $114,700. More sit between $113,500 and $112,000, and these levels may help cushion declines if buyers lose control.
Bitcoin Bull Indicators Turn Bearish Despite Recovery
Even as Bitcoin reclaimed $115,000, market signals indicate cooling conditions. According to CryptoQuant, eight out of ten bull market indicators have flipped bearish.
Only “demand growth” and “technical signal” are currently positive. Metrics like profit and loss indexes, inter-exchange flow pulse and stablecoin liquidity are now showing weakness.
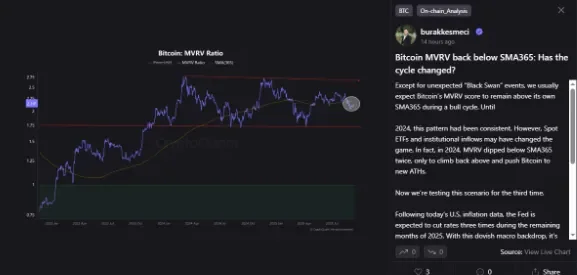
The MVRV-Z score, in particular, is Bitcoin’s market value to realised value. It measures the ratio between the price of Bitcoin to its realised value.
According to CryptoQuant, this metric has dipped below the SMA365. When combined with how the FED is expected to cut interest rates in a few days, CryptoQuant says that the market is no longer about parabolic rallies anymore.
Instead, the market has become a “staircase”, with slow and steady climbs.
Additionally, CryptoQuant’s Bull Score Index, which blends all ten indicators, is now fluctuating between 20 and 30. This indicates weaker confidence compared to earlier in the year.
Meanwhile, CoinGlass’ Bull Run Index currently sits at 74 and indicates that the bull market is about three-quarters through. Yet only one of its 30 peak indicators (the altcoin season index) has triggered.
Bitcoin Price Nears $116K Once Again.
On Friday, Bitcoin touched $116,000 for the first time in three weeks. The move leaves the asset less than 7% away from its all-time high.
Compared to past cycles, this correction has been shallow and is reinforcing the idea that the bull market is not yet finished.
For now, all eyes are on whether Bitcoin can stay above $115,000 and build momentum toward $120,000.

Ivan Petrov is a seasoned journalist with deep insights into Russia’s dynamic crypto landscape. His work focuses on market dynamics and the transformative potential of blockchain technology, making him a go-to expert for understanding Russia’s digital financial innovations.