


Key Insight
- According to analysts, XRP must hold above $2.80 to avoid a deeper correction toward $2.00
- Despite the short-term risks, these analysts still see bullish cycle targets between $19 and $30.
- The asset’s ongoing symmetrical triangle pattern shows a possible breakout toward $4
XRP price action is under pressure as September inches closer. After the asset peaked at $3.66 in July, it dropped over 22% and is trading near $2.84 at the end of August.
The decline has been a significant source of questions about whether the token will face another sell-off this month.
Onchain Data Flags Breakdown Risk
Glassnode’s cost basis heatmap shows that around 1.71 billion XRP were acquired between $2.81 and $2.82. This large supply cluster makes the $2.80 area a major support zone.
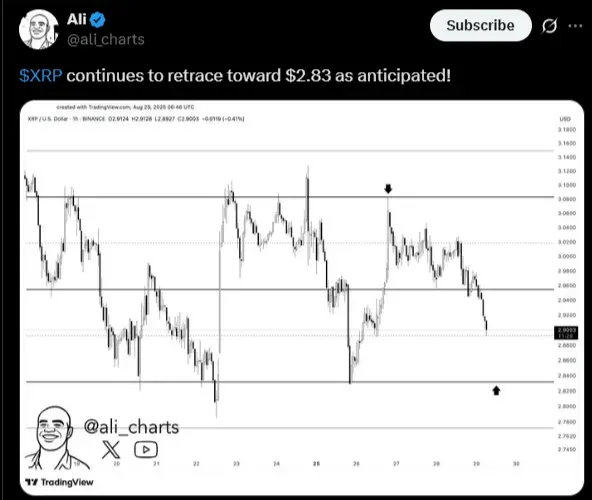
Analyst Ali further pointed out this price level in a recent X post. He noted that XRP is trending towards it “as anticipated”, after failing to break above $3.1.
Many holders could see their profits erased if prices fall below that range. Such a move may even lead to profit-taking and drive XRP closer to the 0.5 Fibonacci retracement level near $1.73.
That level previously acted as a floor earlier in the year. It may again become an essential support if the current one fails.
XRP Macro Outlook Still Points Higher
Despite the short-term risks, analysts are still bullish in the long term for XRP. The token’s current structure is in a consolidation phase within a symmetrical triangle pattern. This tends to point towards preparation for a significant move.
For context, XForceGlobal, a popular crypto analyst, believes that the cycle target for XRP is still above $20 intact. The analyst says XRP’s recent pullback resembles past corrections before strong rallies.
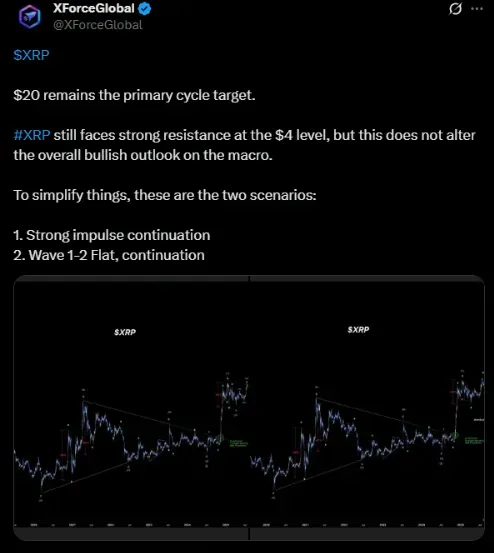
XForceGlobal believes that XRP is in a distribution phase before a larger upward breakout. Two possible scenarios are now under discussion.
Within one, the current decline is setting up a new base before a strong rally. Conversely, XRP continues its flat trading phase between Wave 1 and Wave 2 before entering a Wave 3 surge to the upside.
Symmetrical Triangle Points to $4 Target
According to the daily chart, XRP currently trades within a symmetrical triangle. This means that a daily close above $3 would confirm a breakout. After that, the next significant resistance is at $3.66, which is the token’s multi-year high.
The measured move from the triangle points to $4, a possible 34% rally from current levels. If bulls break past $3.66, further upside toward $4.40 to $6 becomes possible.
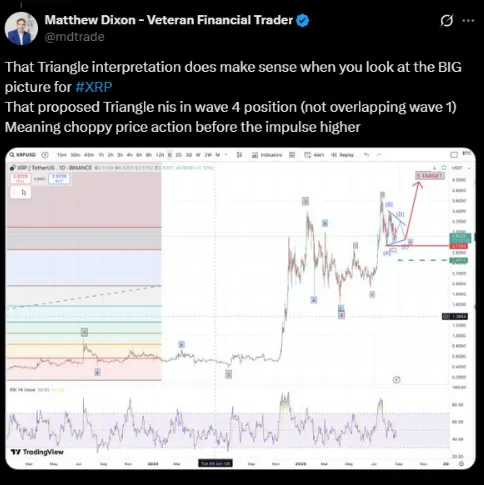
Veteran trader Matthew Dixon also noted that the triangle structure fits XRP’s larger wave pattern. He said the token is currently in a distribution phase between Waves 3 and 4. A Wave 5 rally toward the $4 mark is expected to follow.
Can XRP Avoid a September Crash?
The short-term picture depends heavily on the $2.80 support zone. If it holds, XRP could rebound toward $3 and attempt a breakout. If it fails, however, the token is at risk of a deeper correction toward $2.00 or even $1.73.
Long-term investors should note, though, that the outlook is still positive. Analysts believe XRP is still a candidate for a strong rally and has cycle tops possibly well above $20.
XRP Price Outlook
XRP is about to enter September at a crossroads. The cryptocurrency holding $2.80 support keeps the bullish case alive. Also, a push towards $4 could still be in play if the symmetrical triangle breakout confirms.
A breakdown, however, could delay any more gains and send the token toward lower supports. Analysts are overall confident in XRP’s future over the long term.
However, near-term traders must watch price action. The next few weeks will determine whether XRP can rebound or will inevitably suffer a correction before resuming its climb.

Ivan Petrov is a seasoned journalist with deep insights into Russia’s dynamic crypto landscape. His work focuses on market dynamics and the transformative potential of blockchain technology, making him a go-to expert for understanding Russia’s digital financial innovations.